
Valpak® conducted a survey (1,856 respondents) to determine consumer advertising preferences, the most popular advertising channels, and what drives consumers to choose one over another, including:
- Top advertising channels seen as the most trustworthy
- Motivating factors to try or switch to a new business
- Types of coupons most likely to be saved or redeemed
- The advertising channels with the best response rates
- How far potential customers will travel in their everyday lives to try a new business
Use this data to develop a more robust marketing strategy and to make smarter advertising decisions.
Consumer Advertising Channel Preference

Today’s consumers receive many ads from local businesses through various channels (print, tv advertising, digital ads, etc). But how they like to receive them comes down to preference. Our surveyed respondents overwhelmingly prove that direct mail remains a powerful advertising tool with a strong consumer demand behind it. Up to 84% of those surveyed prefer to receive ads from local businesses by direct mail vs. email (41%), TV (17%), radio (9%) and social media (7%).
Ad Trustworthiness
“I do not use social media to look for product/service purchases…Their platforms do not care what is being advertised and do not check out to see if the company exists.”
The internet is getting busier every day, and with so much content (search engines, online ads, personal data and more), it is often difficult to decide which ads can be trusted. However, our survey respondents agree that traditional channels such as direct mail, newspaper and TV, are more trustworthy.
Top 5 most-trusted ad channels
- Coupons/ads in the mailbox
- Newspaper
- Television
- Radio
Ad Responsiveness
28% of U.S. adults responded to ads/coupons in the mailbox in the past 30 days.
“Where I shop depends on what I need at the time, who has it at the most reasonable price, and then I decide where to go. I will pay a little more to avoid certain places.”
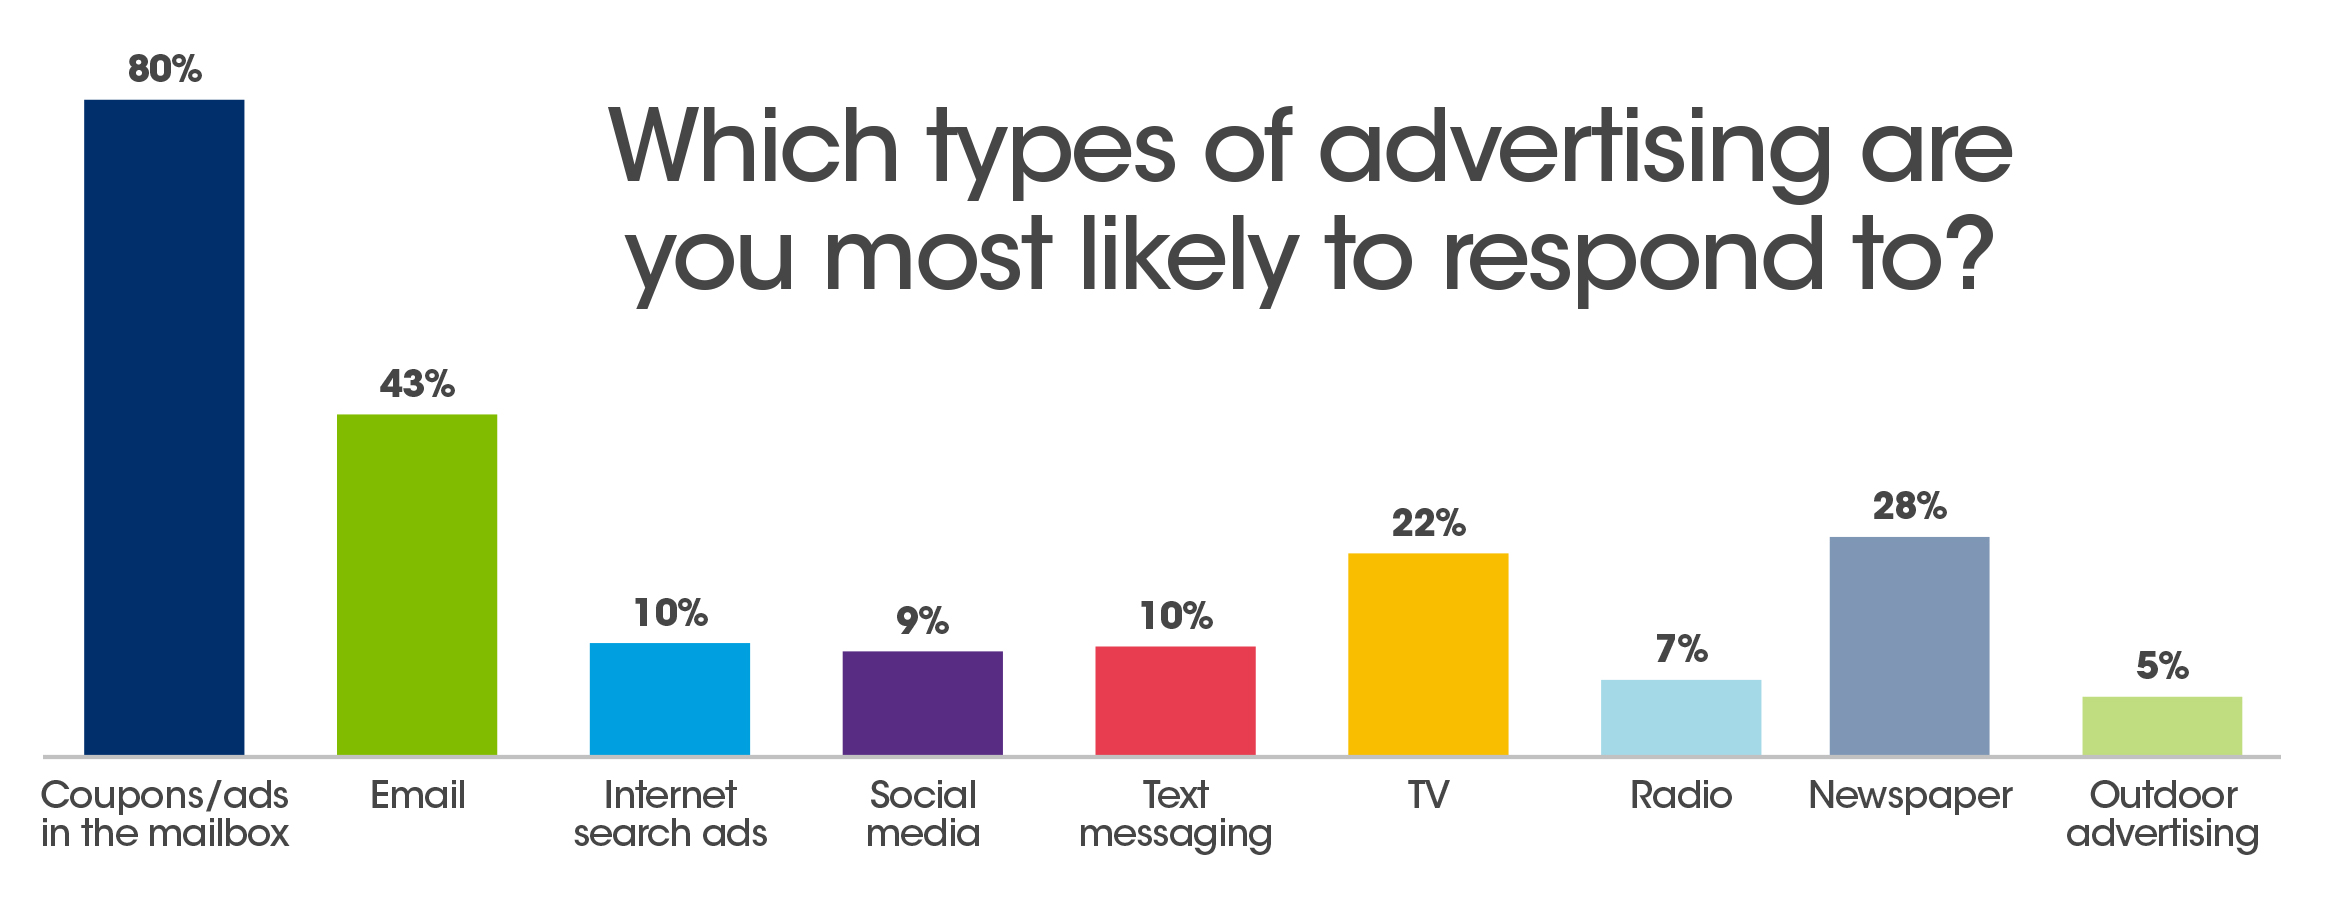
Several of our surveyed respondents shared similar opinions regarding shopping local and their needs vs. savings and price. However, when asked which types of advertising they were most likely to respond to, the overwhelming response was coupons/ads in the mailbox (80%).
Impulse Purchase-Driven Advertising
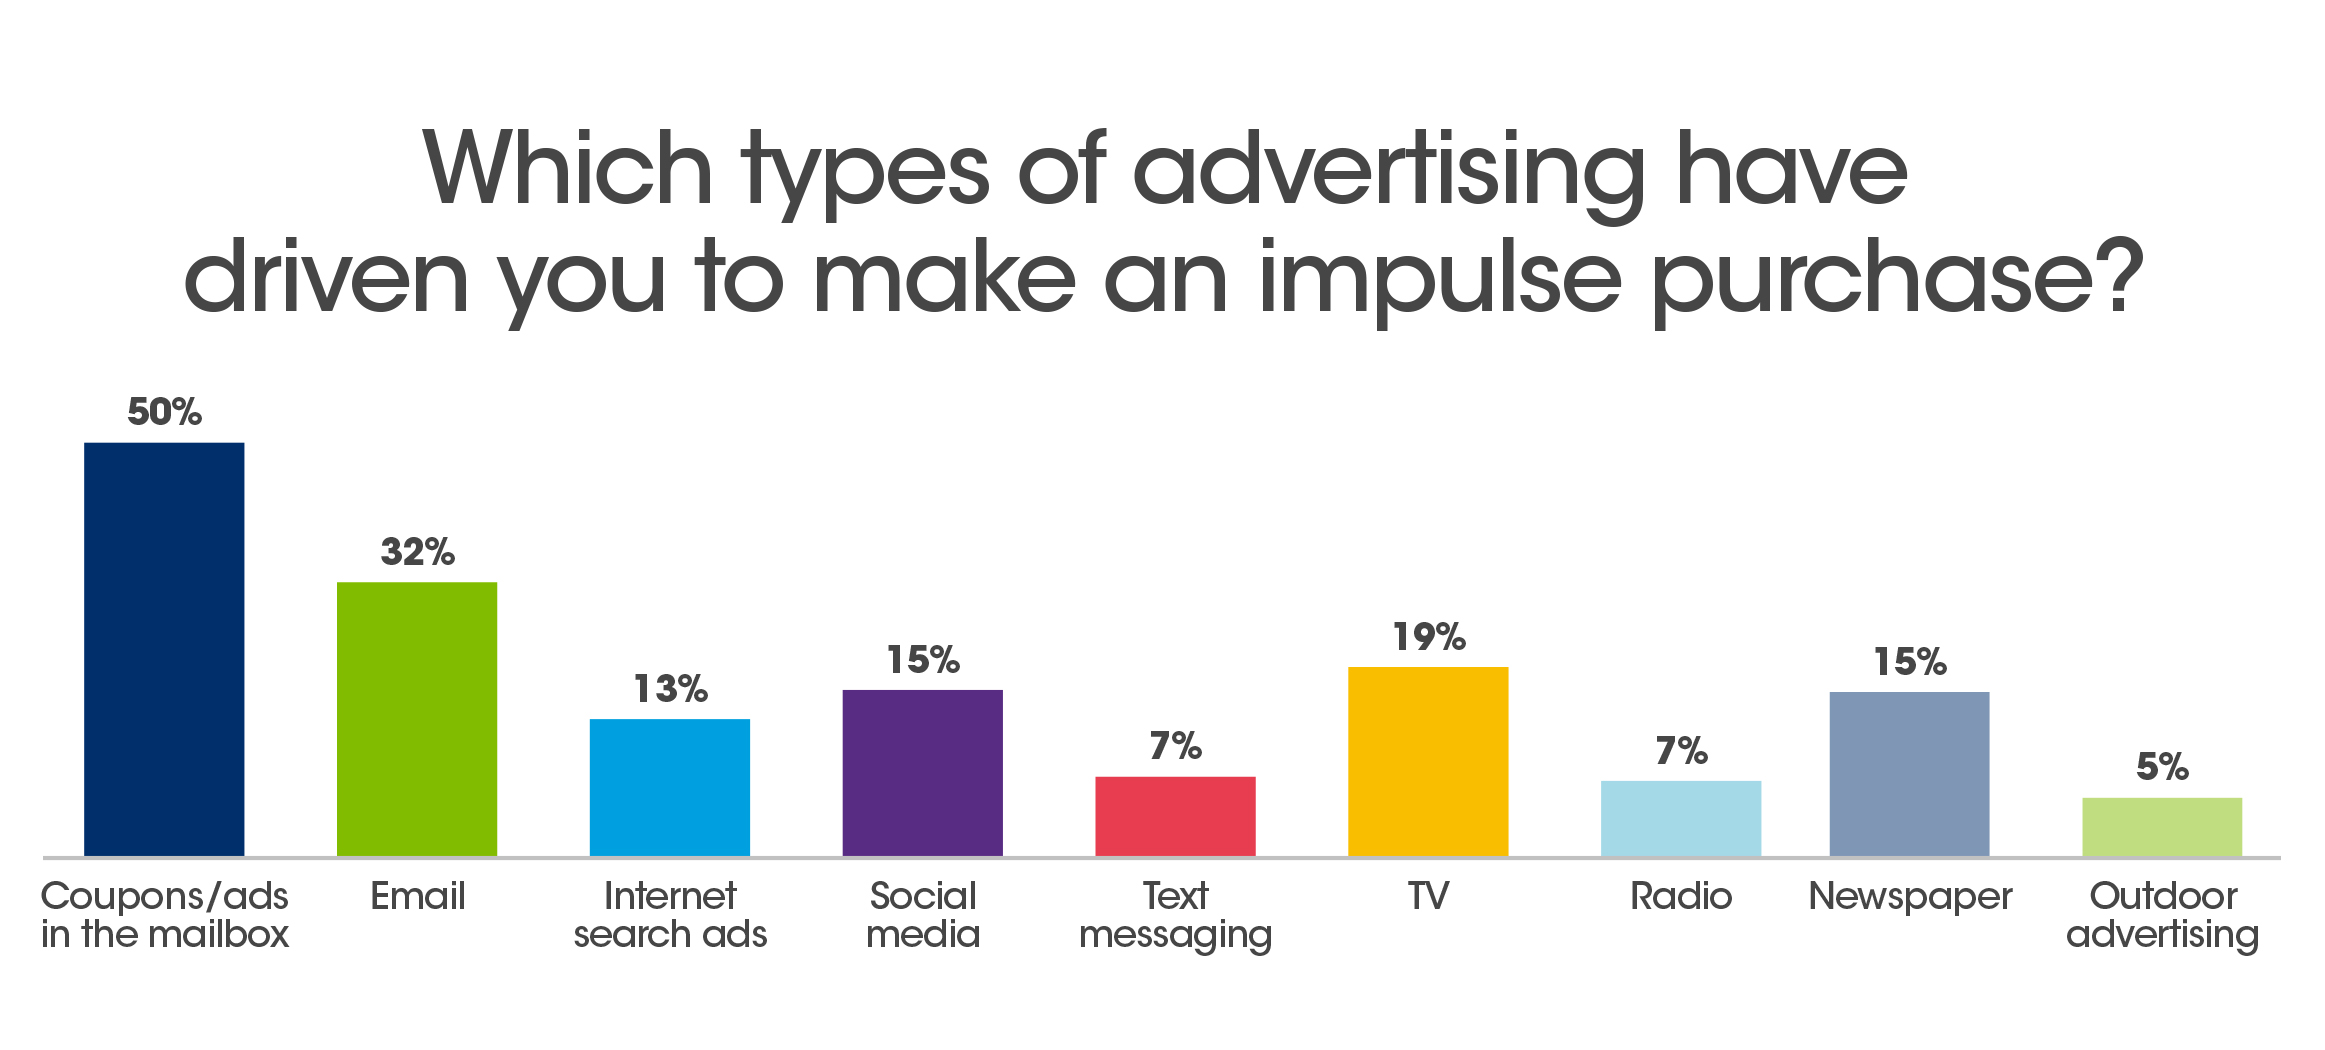
Half of our survey respondents (50%) made impulse purchases from coupons/ads in the mailbox vs. email (32%) or TV (19%).
Coupon Usage & Preferences
96% of our survey respondents use coupons. Of those, 35% prefer print coupons, only 5% prefer digital coupons, while 54% prefer both.
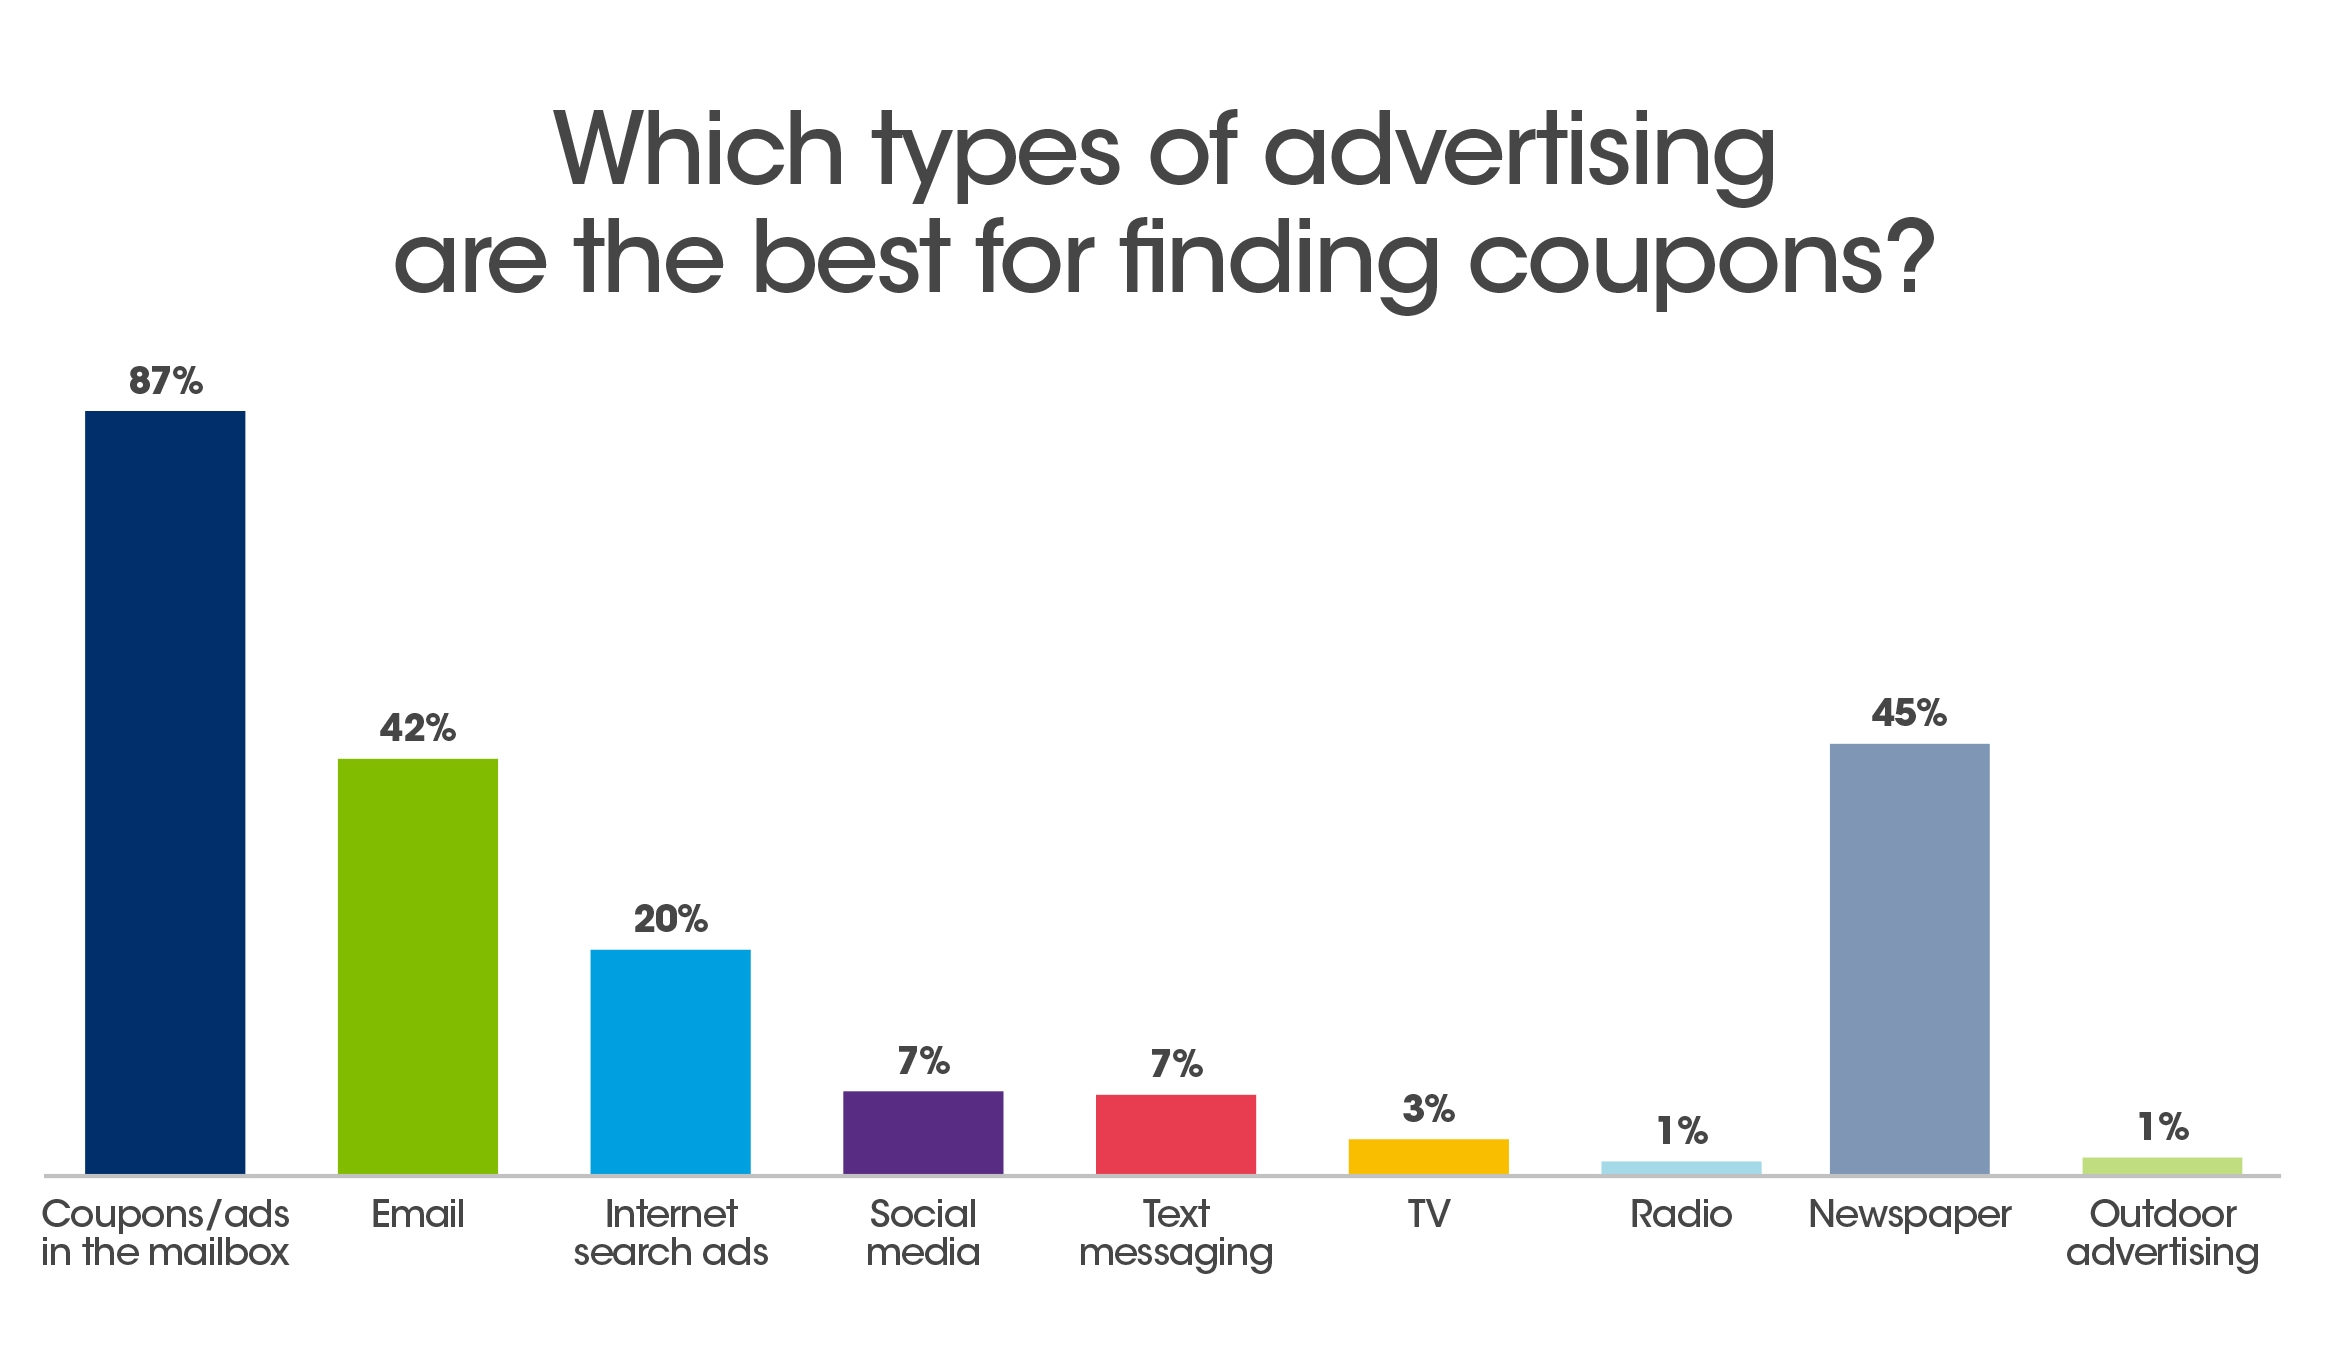
64% of consumers usually read the ads they receive in their mailboxes, and there is a clear preference for coupons from tried-and-true advertising channels.
Consumer Coupon Hierarchy
“Don’t find as many coupons lately that are of interest to me. Mostly my interests are grocery items and restaurant coupons.”
Targeting consumers matters. 17% of U.S. adults usually make buying decisions based on which coupons they have.
A Coupon in the Hand

A coupon arrives in a mailbox and into a consumer’s hands. It can be folded, placed in a pocket, pinned to a bulletin board, or slipped into a wallet or purse. It is the same tangible coupon an hour, day, or a week later. While free shipping is now par for the shopping course, the cost of goods and services can be uncertain; however, like U.S. currency – the paper coupon’s value is unmistakable.
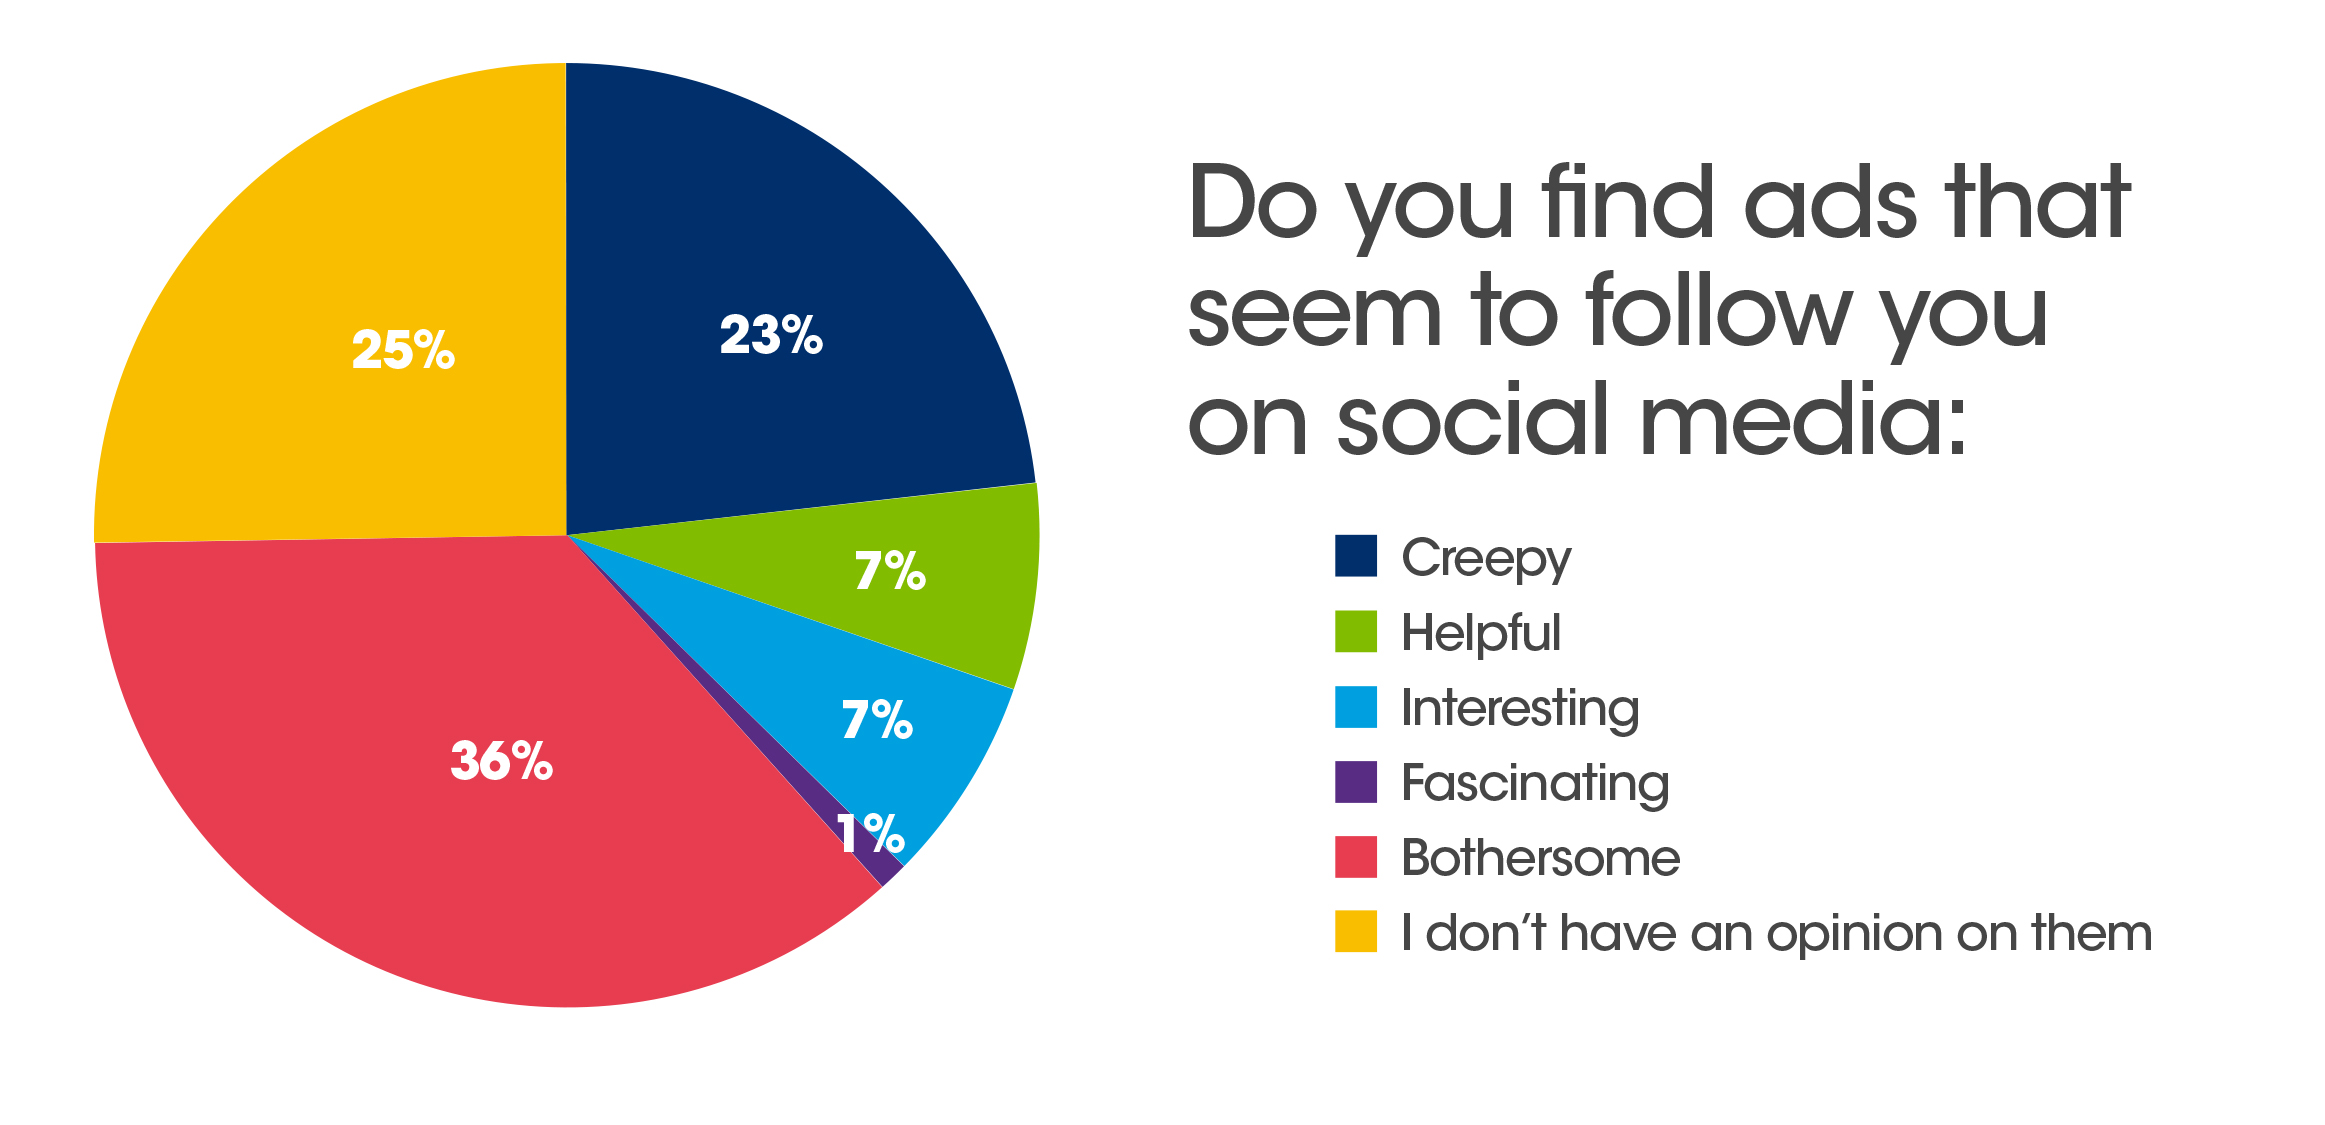
Social Media Usage & Ad Options
Knowing which social media platforms your consumers use can make a big difference.
More than three-quarters of our respondents surveyed (76%) use Facebook vs. YouTube (38%), Instagram (37%), Pinterest (36%), and Twitter (32%).
But all that glitters is not gold.

“They’re [ads are] coming to get you, Barbara!”
Customer Review-Influenced Purchasing
78% of our respondents are influenced by customer reviews while buying a product, with 17% rarely inspired by a good or bad review – they want what they want.
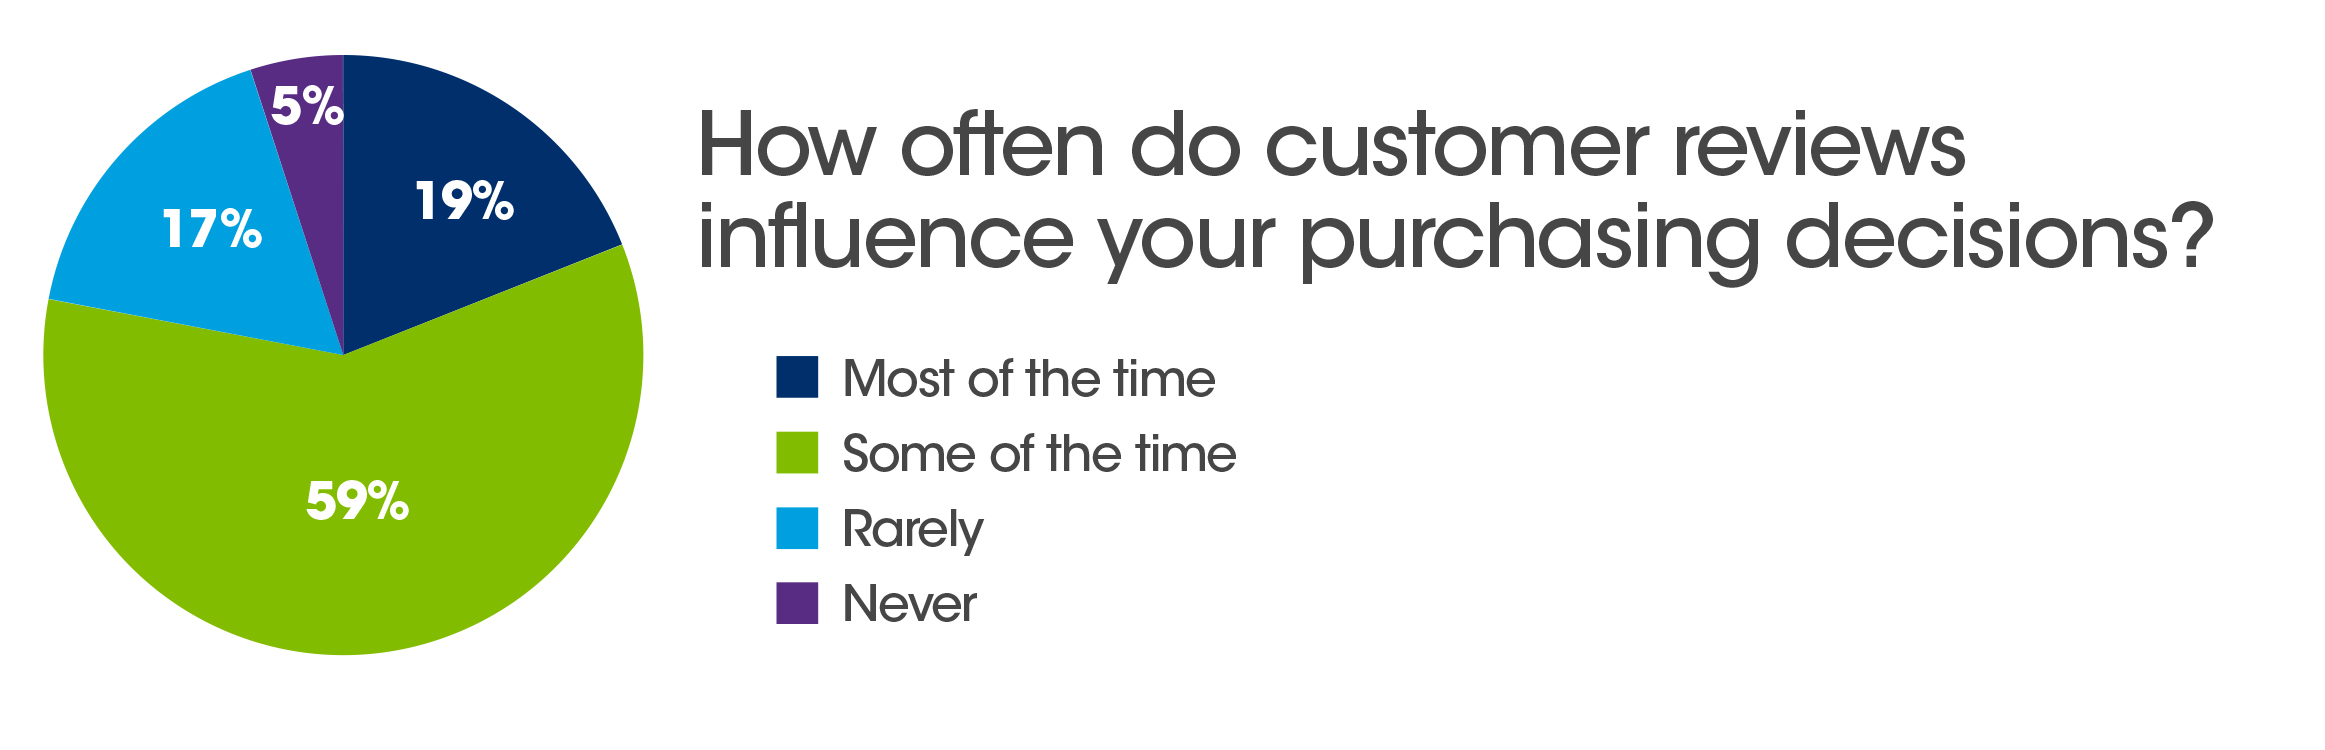
However, 49% of U.S. adults usually read reviews or comments from others who have purchased the product they are considering and share their customer experience, and 54% have read reviews in the past 12 months.
When it comes to home renovations or big-ticket electronics items, where large sums of cash get exchanged, a costly mistake is often avoided by reading what real customers who made the same purchase have to say.
When choosing a new restaurant, price, proximity, franchise, or style sometimes plays a much more significant role in trying something different.

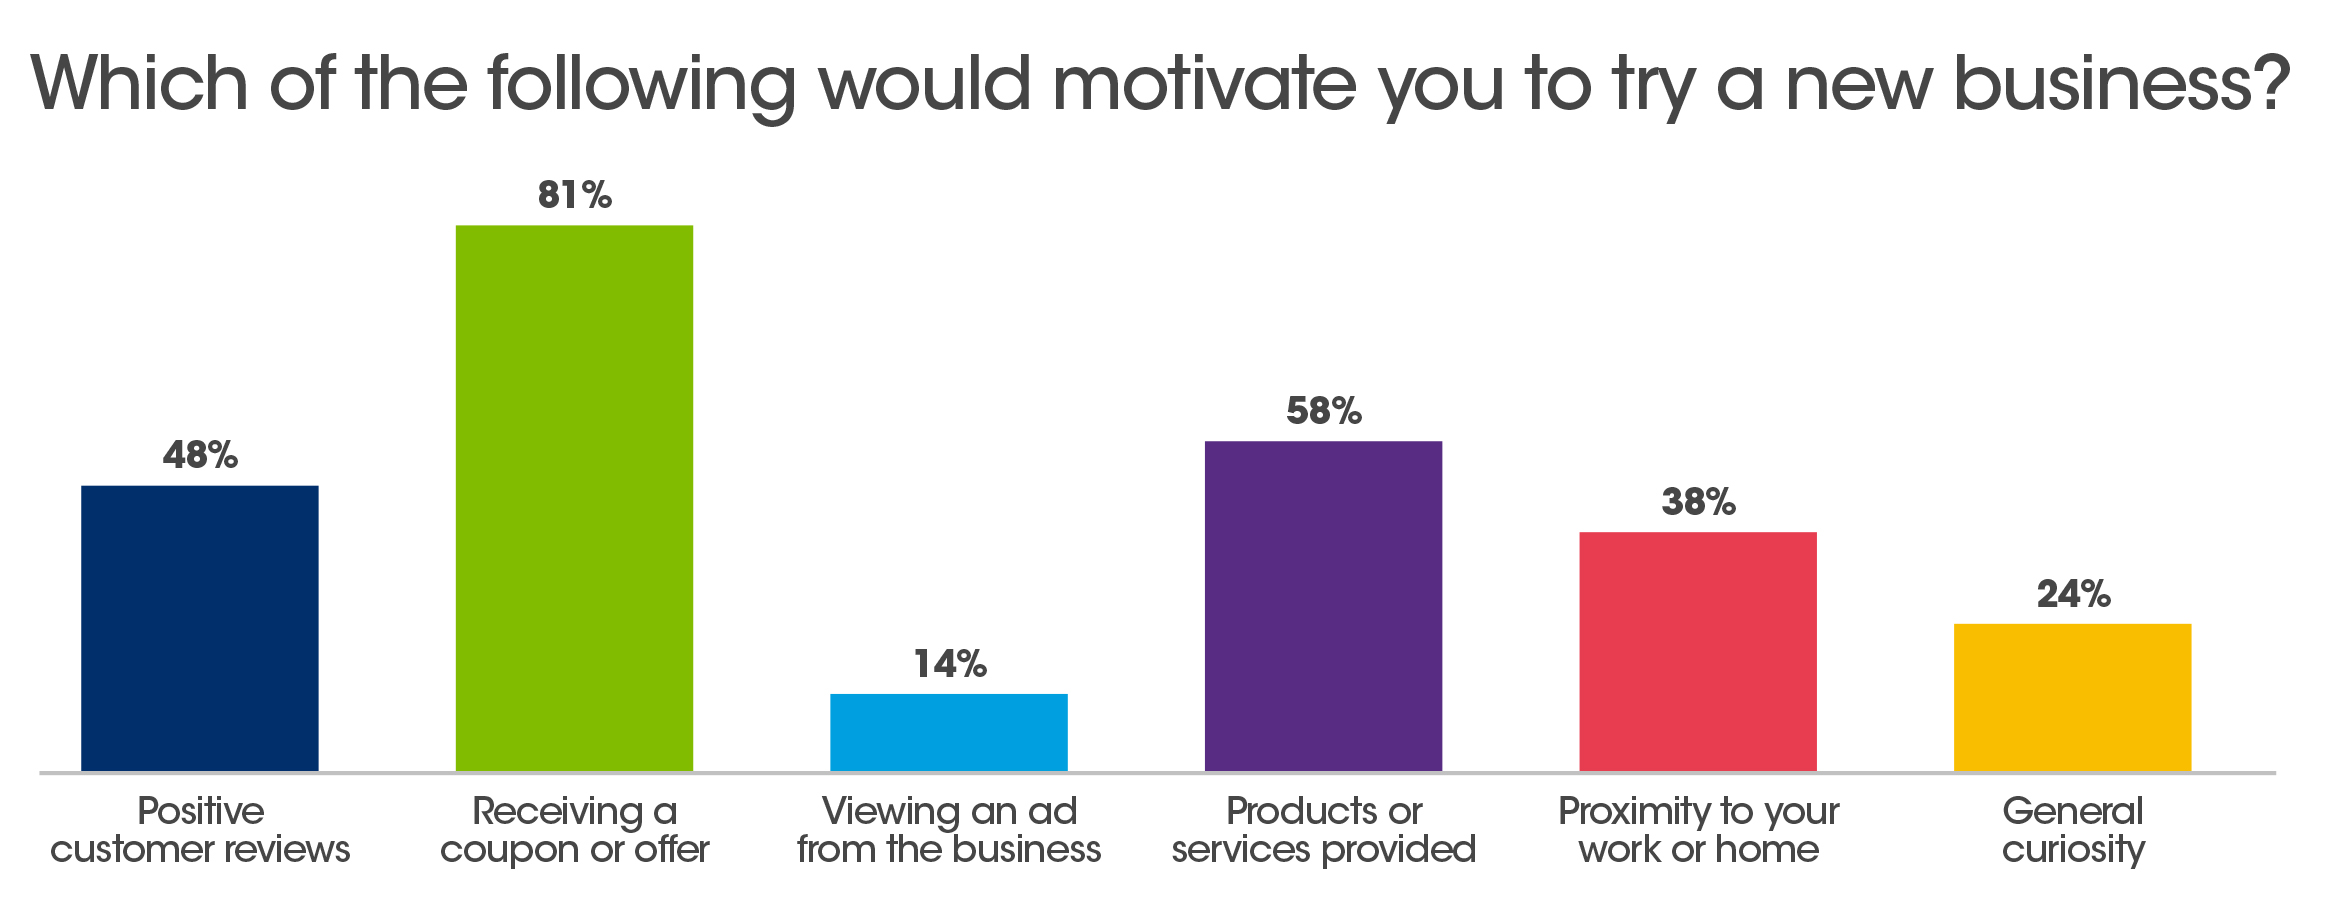
Motivating Consumers to Try or Even Switch to a New Business
Proximity to work/home plays a prominent role as 38% of our consumers are motivated by offers from businesses within their daily footprint.
81% of respondents are motivated to try a new business upon receiving a coupon or offer. In addition, 58% would switch based on products and services provided.
Certain types of businesses are staples in consumers’ lives such as health care, hair salons, and auto repair. However, once a consumer is looking for something new – maybe prices increase, they had a bad experience, or they move – it’s best to be there when they’re ready.
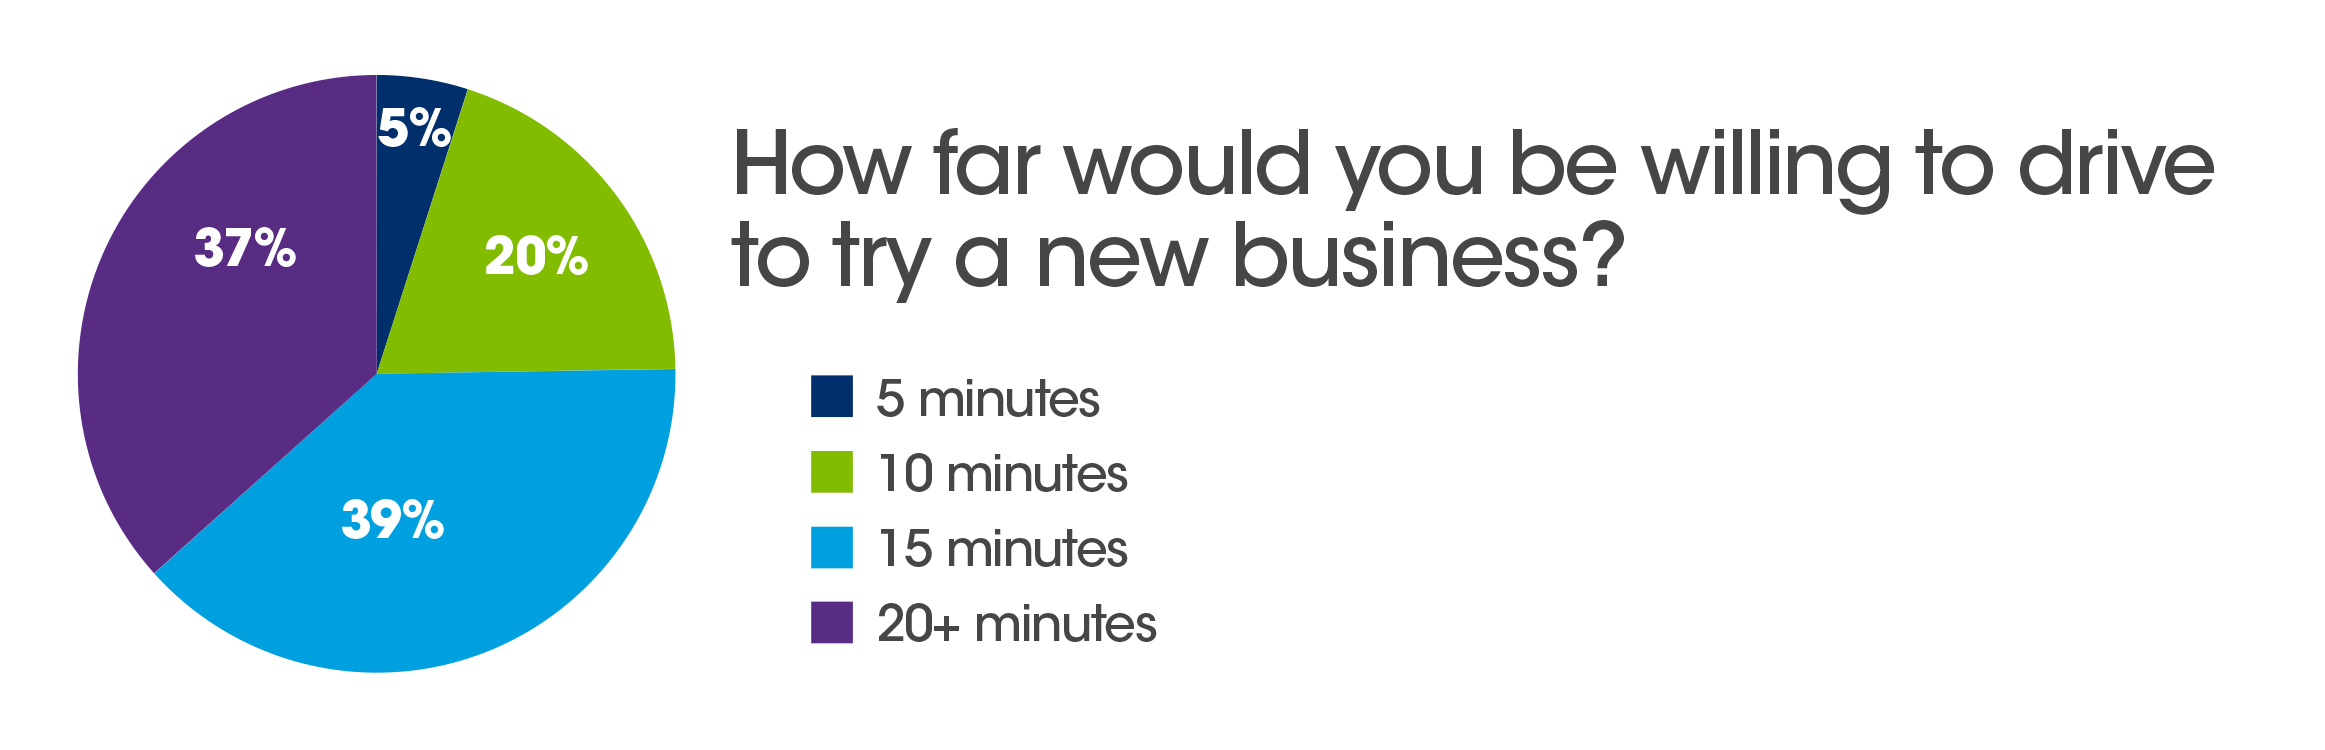
Most Consumers are Willing to Travel to Try a New Business

It’s not the distance but the destination. Some consumers are willing to sacrifice a little time on the road to get to the right location if it serves a specific need (consumer behavior). For example, of the respondents surveyed, 38% are willing to drive 15 minutes to try a new business, and 37% up to 20 minutes.
Consumers are willing to drive:
- 8 minutes to reach a quick-service restaurant
- 14 minutes to get to hair/beauty salons
- 20 minutes to see a movie
- 28.4 minutes to receive primary care
What is available depends on where consumers live (real estate), whether in a city (like New York) or rural. If there is a want for a good or service, hitting the open road for a half-hour is worth it.
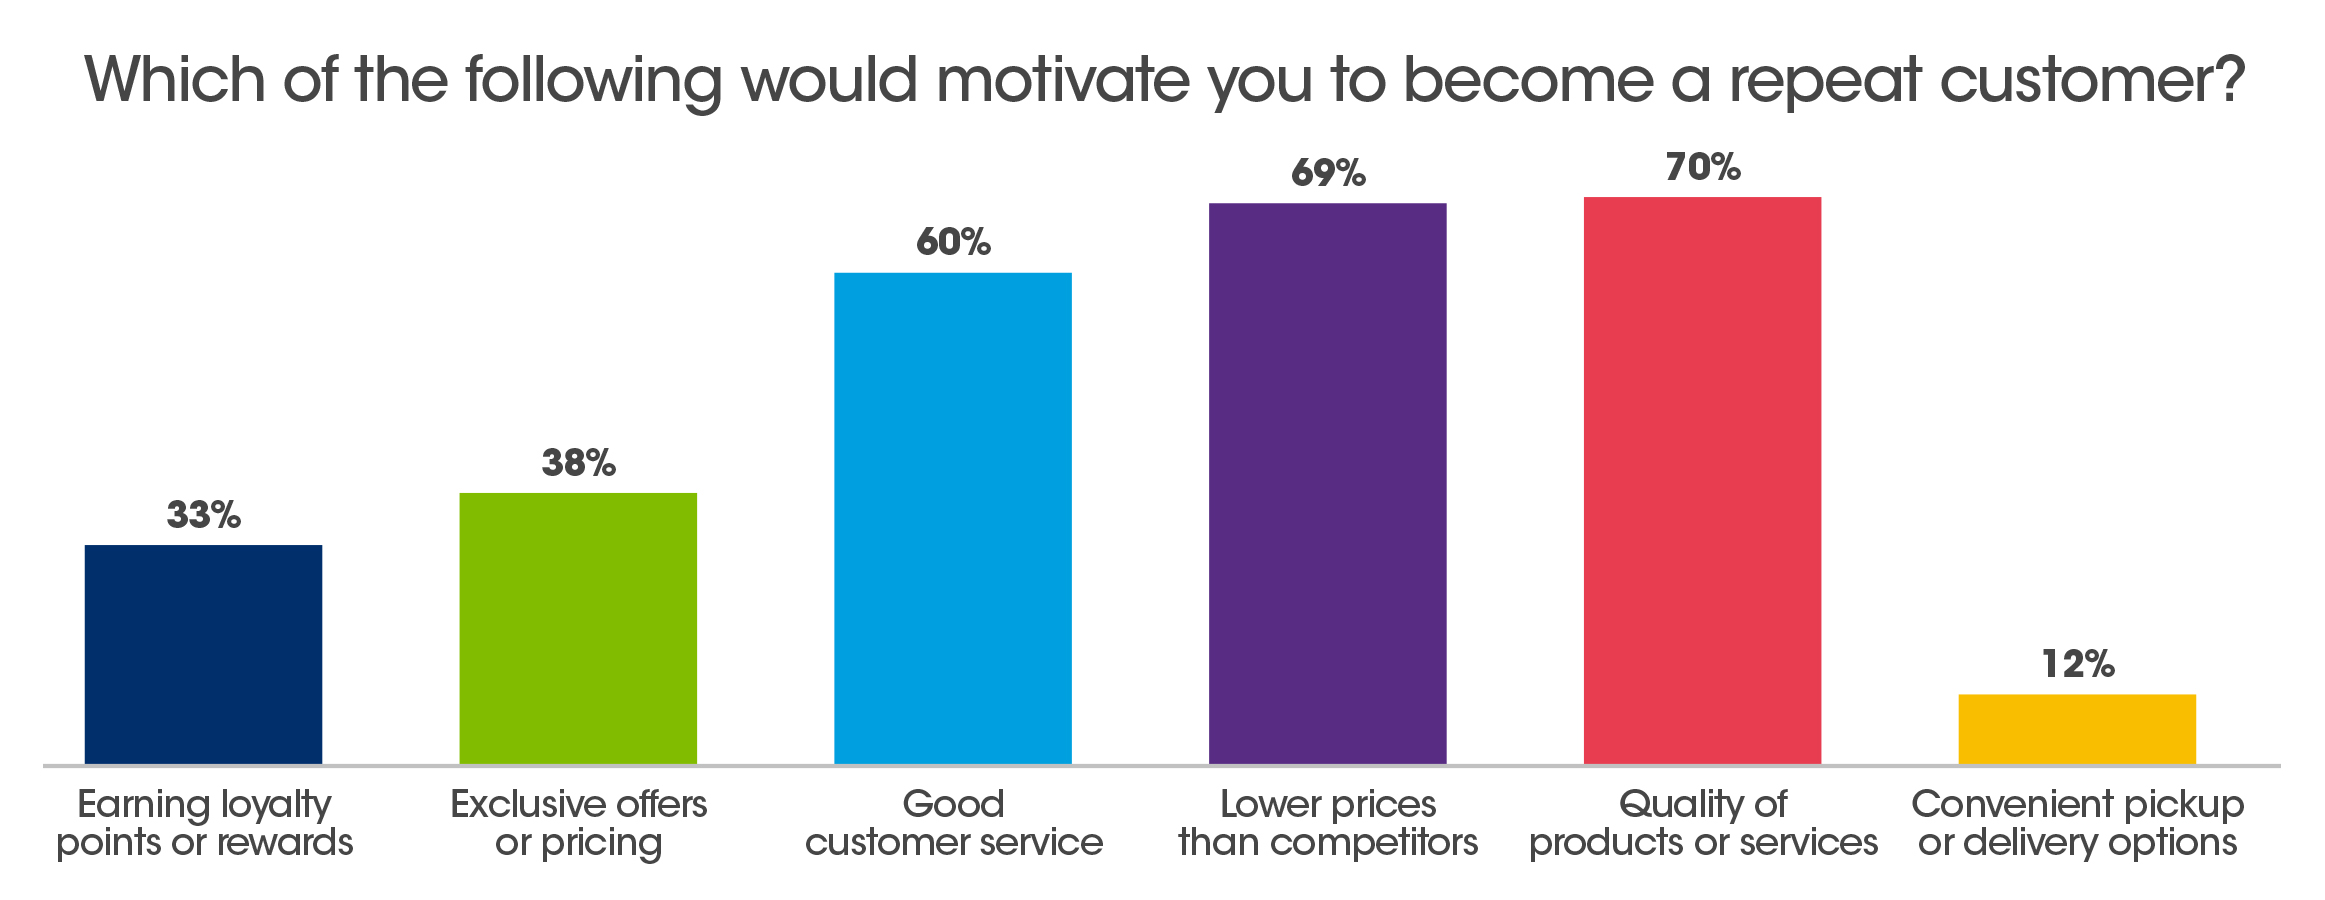
Turning a New Customer into a Repeat Customer
Along with the quality of new products/services and lower prices than competitors, 60% of respondents credit good customer service (customer experience) as motivation to become repeat customers. Multiple-choice questions can be taxing on the phone and feel like market research, whereas speaking to a live, knowledgeable person is rewarding and satisfying to a customer (and creates positive consumer sentiment).
Increasing customer retention by 5% can increase profits from online sales by 25% to 95%. There is great value in customer retention. With all the opportunities to share these days, loyal returning customers often create new ones.
Get More Customers with Valpak
Creating the right ad is paramount to your marketing efforts. However, trust and channel are equally important – tapping into that granular consumer sweet spot (brand loyalty) combines research and location.
Knowing the services your target audience is looking for and which offers generate the most response is critical to your advertising success (e-commerce, small business, and more). But there is more work to do to ensure your marketing campaign drives revenue. Your local Valpak marketing professional can help determine which products (ad/coupons, postcards, digital marketing) are the best fit for your business, the ideal reach and frequency for your ad campaign and more.


